
Almost all weather phenomena takes place in the troposphere, which is the lower part of the atmosphere, although the stratosphere above can impact weather lower down. Exactly how the stratosphere and the troposphere interact with each other remains largely unknown but we will hopefully learn more about it in the future.
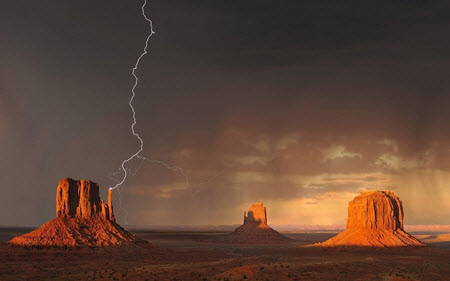
Examples of commonly occurring weather phenomena are wind, rain, snow, fog and thunderstorms, and then we also have more unusual events such as tornadoes, hailstorms, ice storms and cyclones.
The effects of weather phenomena are constantly reshaping the surface of our planet in various ways. Rocks and stones are broken down into smaller pieces, rains can cause soil erosion, suspended materials are transported to lakes and oceans, heavy swells caused by strong winds can shape and re-shape sandy coastlines, and so on.
Weather forecasting
Humans have tried to predict, and sometimes even influence, the weather for millennia. In our modern time, we use science and technology to aid us in these efforts, but the atmosphere is a system where even a very small change can set off a chain reaction that come to have enormous consequences. Because of this, forecasting the weather is notoriously difficult, especially when it comes to making forecasts for more than a few days into the future.
It is possible to buy insurance to prevent you from future weather event. It is also possible to speculate in weather options. Weather options allows those able to correctly forecast the weather to make a lot of money. Most of these options do however require you to forecast the weather far in to the future. Trading these options are more gambling than investing. It is in many areas of the world very hard to reliable forecast the weather more then 7-14 days into the future. You can read more about weather based options on this page.
The extremes
Highest air temperature

The record air temperature registered with the World Meteorological Organization (WMO) is 56.7 degrees C measured at Furnace Creek (Greenland Ranch), California, USA on 10 July 1913. WMO have suggested that this record-breakingly high temperature might have been caused by a sandstorm. The record is not undisputed, but several other very high temperatures have been recorded in the same area, the so called Death Valley of the United States, including 54 degrees C on 30 June 2013 and 53.9 degrees C in July 1960, 1998, 2005, and 2007.
Examples of other very high air temperatures:
-
- 54.0 degrees C in Mitribah, Kuwait on 21 July 2016
- 54.0 degrees C at the airport of Ahvaz, Iran on 29 June 2017
- 53.9 degrees C in Basra, Iraq on 21 July 2016
The standard for measuring temperature is measuring the air temperature 1.5 meters above the ground, in a spot shielded from direct sunlight intensity. If you measure the temperature in the sunlight instead, you will of course get a higher reading. Also, measuring closer to the ground than 1.5 meters can have a major impact on the result, as the temperature directly on the ground can exceed air temperature by up to 50 degrees C.
Lowest air temperature
The lowest natural air temperature recorded at ground level on Earth is −89.2 °C. This record was set at the Soviet Vostok Station in Antarctica on 21 July 1983.
Lowest surface temperature
Thanks to remote sensing satellite technology, we know that the spot 81.8°S 59.3°E on Antarctica had a surface temperature of −93.2 °C on 10 August 2010. This spot is located along a ridge between Dome Argus and Dome Fuji, at 3,900 meters above sea level.
Global Weather & Climate Extremes
Notable meteorological records: temperatures, precipitation, winds & atmospheric forces
| Record | Value | Location | Date |
|---|---|---|---|
| Highest natural ground surface temp. | 93.9 °C (201.0 °F) | Furnace Creek, California, USA | 15 July 1972 |
| Greatest temperature rise in 2 mins | +27 °C in 2 min -20 °C to 7 °C (-4 °F to 45 °F) | Spearfish, South Dakota, USA | 22 January 1943 |
| Most consecutive days >100 °F (37.8 °C) | 160 days | Marble Bar, WA, Australia | 31 Oct 1923 – 7 Apr 1924 |
| Record | Value | Location | Date |
|---|---|---|---|
| Most rain in 1 minute | 38 mm (1.5 in) | Barot, Guadeloupe (Caribbean) | 26 November 1970 |
| Most rain in 1 hour | 305 mm (12.0 in) | Holt, Missouri, USA | 22 June 1947 |
| Most rain in 24 hours | 1,825 mm (71.9 in) | Cilaos, Réunion | 7–8 January 1966 |
| Most rain in 1 year | 26,470 mm (1,042.1 in) | Cherrapunji, Meghalaya, India | 1860–1861 |
| Most snow in 24 hours | 256 cm (100.8 in) | Capracotta, Italy | 5 March 2015 |
| Most snow in a calendar month | 9.91 meters (390.2 in) | Tamarack, California, USA | January 1911 |
| Heaviest hailstone | 1.02 kg (2.25 lb) | Gopalganj District, Bangladesh | 14 April 1986 |
| Largest hailstone diameter | 20 cm (8.0 in) | Vivian, South Dakota, USA | 23 July 2010 |
| Record | Value | Location | Date |
|---|---|---|---|
| Greatest wind speed (gust) 3-second radar gust via DOW unit | 484 ± 32 km/h (302 ± 20 mph) | Between Oklahoma City & Moore, OK, USA | 3 May 1999 |
| Fastest 24-hr average wind speed | 174 km/h (108 mph) | Port Martin, Antarctica | 21–22 March 1951 |
| Deadliest tornado | ~1,300 deaths | Daulatpur–Saturia, Manikganj, Bangladesh | 26 April 1989 |
| Lowest sea-level pressure (Cyclone) | 870 hPa (25.69 inHg) | Super Typhoon Tip (NW Pacific Ocean) | 12 October 1979 |
| Lowest sea-level pressure on land | 892 hPa (26.35 inHg) | Labor Day Hurricane (Craig Key, FL, USA) | 2 September 1935 |
| Record | Value | Location | Date |
|---|---|---|---|
| Longest lightning bolt distance | 321 km (199.5 miles) | Oklahoma, USA | 20 June 2007 |
| Longest lightning flash duration | 7.74 seconds | Provence-Alpes-Côte d’Azur, France | 30 August 2012 |
| Highest recorded UV index | 43.3 UV Index | Licancabur volcano, Chile–Bolivia border | 29 December 2003 |